Visualise Randomness
It has been almost half year since my last blog post on OCaml. Well, actually I haven't even touched OCaml for that long time. My current job (in Python) got much busier. But finally, things camls calms down a bit now. I can at least have time sitting in front of my 2008 macbook pro, opening terminal, doing
opam update

opam upgrade

opam switch 4.02.3

eval `opam config env`
Hmmmm, I like this feeling.
typeocaml is back now. I digged my typeocaml notebook from one of our 78 packing boxes, and went through the list of many things about OCaml that I planned to write about. Those items still look familiar but obviously not very clear in my mind now. One should never put a vacuum space in things beloved. They would fade.
Anyway, enough chit-chat, back to the topic.
This post is about visualising the randomness of random number generators. It will be lightweight and is just something I did for fun with OCaml. We will know a good way to test randomness and also learn how to create a jpg picture using an OCaml image library: camlimages. I hope it would be tiny cool.
What is randomness?
Say, we got a function var ran_gen : int -> int from nowhere. It claims to be a good random integer generator with uniform distribution, which takes a bound and "perfectly" generates a random integer within [0, bound). The usage is simple but the question is can you trust it or will the numbers it generates be really random?
For example, here is a rather simple ran_gen_via_time:
let decimal_only f = f -. (floor f)
let ran_via_time bound =
  ((Unix.gettimeofday() |> decimal_only) *. 100,000,000. |> int_of_float) mod bound
(*
  Unix.gettimeofday() returns float like 1447920488.92716193 in second.
  We get the decimal part and then amplify it to be integer like, i.e., 1447920488.92716193 ==> 0.92716193 ==> 92716193.
  Then we mod it by bound to get the final "random" number.
*)
This generator is based on the timestamp when it is called and then mod by the bound. Will it be a good generator? My gut tells me not really. If the calls to the function has some patterns, then eaily the numbers become constant.
For example, if the bound is 10, then at t I make first call, I will get t mod 10. If I call at t + 10 again, I will get (t+10) mod 10 which is actually t mod 10. If I call it every 10 seconds, then I get a constant. Thus this generator's randomness would not be as good as it claims to be.
For any given random number generator, we have to really make sure its randomness is good enough to suite our goal, especially when we have to rely on them for trading strategies, gaming applications, online gambling hosting, etc.
However, we also need to be aware of that most of random generators are not perfect (Random number generator and Pseudorandom number generator). What we often do is just to see whether the randomness of a given generator can reach a certain level or not.
Test randomness using statistics
Chi-squared test is a fairly simple and common methodology to test randomness mathematically.
Say, we have a generator producing random integers between [0, 10) with uniform distribution. So ideally, if the generator is perfect, and if we ran 1000 times, then there would be 100 of 0, 100 of 1, ..., 100 of 9 , right? For the test, we can just try the generator N times, and see whether the frequency of each number generated somehow matches or is close to N / bound.
Of course, the frquencies of numbers would not exactly match expectation. So we need some mathematics to measure the level of matching.
- k is the number of possible candidates - e.g., k = 10 for [0, 10)
- Ei is the expected frequency for each candidate - i = 1, 2, k
- Oi is the frequency for each candidate produced by the generator - i = 1, 2, k
Thus we can get X^2 = (O1-E1)^2/E1 + ... + (Ok-Ek)^2/Ek
Essentially, the bigger X^2 is, the matching is more unlikely. If we really want to see how unlikely or likely they match each other, then we need to check X^2 against the chi square distribution table like below:

- The Degrees of Freedom is our
k-1(if k = 1, then our freedom is 0, which means we just have one to choose all the time and don't have any freedom). - The bold headings of columns are the probabilities that the observations match the expectations.
- The many numbers in those cells are values of
X^2.
For example, say in our case above, k = 10, so Degree of freedom is 9.
If we get X^2 as 2, which is less than 2.088, then we can say we have more than 0.99 probability that the observations match the expectations, i.e., our random generator follows uniform distribution very well.
If we get X^2 as 23, which is bigger than 21.666, the probability of matching is less than 0.01, so our generator at least is not following uniform distribution.
This is roughly how we could use Chi-squared test for randomness checking. Of course, the description above is amateur and I am just trying to put it in a way for easier understanding.
Test randomness via visualisation
Let's admit one thing first: Math can be boring. Although math can describe things most precisely, it does not make people like me feel intuitive, or say, straightforward. If I can directly see problems and the solutions via my eyes, I would be much happier and this was the reason why I tried to visualise the randomness of generators.
The way of the visualisation is fairly simple.
- We create a canvas.
- Each pixel on the canvas is a candidate random number that the generator can produce.
- We run the generator for lots of times.
- The more times a pixel gets hit, we draw a deeper color on it.
- In the end, we can directly feel the randomness depending on the color distribution on the canvas.
A trivial example
Initially we have such a canvas.
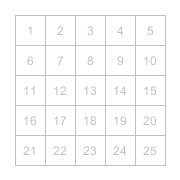
We use the random generator generating numbers. If a slot get a hit, we put a color on it.
If any slot keeps been hit, we put deeper and deeper color on it.
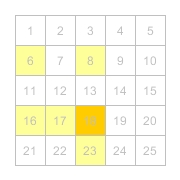
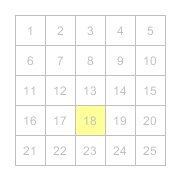
When the generator finishes, we can get a final image.
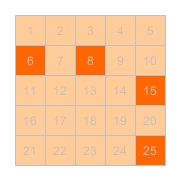
From the resulting image, we can see that several numbers are really much deeper than others, and we can directly get a feeling about the generator.
Of course, this is just trivial. Normally, we can get much bigger picture and see the landscape of the randomness, instead of just some spots. Let's get our hands dirty then.
Preparation
Assuming the essentials of OCaml, such as ocaml itself, opam and ocamlbuild, have been installed, the only 3rd party library we need to get now is camlimagges.
Before invoke opam install camlimages, we need to make sure libjpeg being installed first in your system. Basically, camlimages relies on system libs of libjpeg, libpng, etc to save image files in respective formats. In this post, we will save our images to .jpg, so depending on the operating system, we can just directly try installing it by the keyword of libjpeg.
For example,
- mac ->
brew install libjpeg; - ubuntu ->
apt-get install libjpeg; - redhat ->
yum install libjpeg
After libjpeg is installed, we can then invoke opam install camlimages.
In addition, for easier compiling or testing purposes, maybe ocamlbuild opam install ocamlbuild and utop opam install utop could be installed, but it is up to you.
brew install libjpeg
opam install camlimages
opam install ocamlbuild
opam install utop
The general process
The presentation of an RGB image in memory is a bitmap, which is fairly simple: just an 2-d array (width x height) with each slot holding a color value, in a form like (red, green, blue). Once we have such a bitmap, we can just save it to the disk in various formats (different commpression techniques).
So the process could be like this:
- Create a matrix array, with certain size (width and height)
- Manipulate the values (colors) of all slots via random generated numbers
- Convert the matrix bitmap to a real image
- Save the image to a jpg file
Fill the matrix
First, let's create a matrix.
open Camlimages

(* w is the width and h is the height *)
let bitmap = Array.make_matrix w h {Color.r = 255; g = 255; b = 255}
(*
  Color is a type in camlimages for presenting RGB colors,
  and initially white here.
*)
When we generate a random number, we need to map it to a slot. Our image is a rectangle, i.e., having rows and columns. Our random numbers are within a bound [0, b), i.e., 1-d dimension. A usual way to convert from 1-d to 2-d is just divide the number by the width to get the row and modulo the number by the width to get the col.
let to_row_col ~w ~v = v / w, v mod w
After we get a random number, we now need to fill its belonging slot darker. Initially, each slot can be pure white, i.e., {Color.r = 255; g = 255; b = 255}. In order to make it darker, we simply just to make the rgb equally smaller.
let darker {Color.r = r;g = g;b = b} =
  let d c = if c-30 >= 0 then c-30 else 0
  in
  {Color.r = d r;g = d g;b = d b}
(*
  The decrement `30` really depends on how many times you would like to run the generator
  and also how obvious you want the color difference to be.
*)
And now we can integrate the major random number genrations in.
(*
  ran_f: the random number generator function, produce number within [0, bound)
         fun: int -> int
  w, h:  the width and height
         int
  n:     the expected times of same number generated
         int

  Note in total, the generator will be called w * h * n times.
*)
let random_to_bitmap ~ran_f ~w ~h ~n =
  let bitmap = Array.make_matrix w h {Color.r = 255; g = 255; b = 255} in
  let to_row_col ~w ~v = v / w, v mod w in
  let darker {Color.r = r;g = g;b = b} = let d c = if c-30 >= 0 then c-30 else 0 in {Color.r = d r;g = d g;b = d b}
  in
  for i = 1 to w * h * n do
    let row, col = to_row_col ~w ~v:(ran_f (w * h)) in
    bitmap.(row).(col) <- darker bitmap.(row).(col);
  done;
  bitmap
Convert the matrix to an image
We will use the module Rgb24 in camlimages to map the matrix to an image.
let bitmap_to_img ~bitmap =
  let w = Array.length bitmap in
  let h = if w = 0 then 0 else Array.length bitmap.(0) in
  let img = Rgb24.create w h in
  for i = 0 to w-1 do
    for j = 0 to h-1 do
      Rgb24.set img i j bitmap.(i).(j)
    done
  done;
  img
Save the image
Module Jpeg will do the trick perfectly, as long as you remembered to install libjpeg before camlimages arrives.
let save_img ~filename ~img = Jpeg.save filename [] (Images.Rgb24 img)
Our master function
By grouping them all together, we get our master function.
let random_plot ~filename ~ran_f ~w ~h ~n =
  let bitmap = random_to_bitmap ~ran_f ~w ~h ~n in
  let img = bitmap_to_img ~bitmap in
  save_img ~filename ~img
All source code is in here https://github.com/MassD/typeocaml_code/tree/master/visualise_randomness
Result - standard Random.int
OCaml standard lib provides a random integer genertor:
val int : int -> int

Random.int bound returns a random integer between 0 (inclusive) and bound (exclusive). bound must be greater than 0 and less than 2^30.
Let's have a look what it looks like:
let _ = random_plot ~filename:"random_plot_int.jpg" ~ran_f:Random.int ~w:1024 ~h:1024 ~n:5

Is it satisfying? Well, I guess so.
Result - ran_gen_via_time
Let's try it on the ran_gen_via_time generator we invented before:
let decimal_only f = f -. (floor f)
let ran_via_time bound =
  ((Unix.gettimeofday() |> decimal_only) *. 100,000,000. |> int_of_float) mod bound

let _ = random_plot ~filename:"random_plot_time.jpg" ~ran_f:ran_via_time ~w:1024 ~h:1024 ~n:5

Is it satisfying? Sure not.
Apparently, there are quite some patterns on images. Can you identify them?
For example,

One pattern is the diagonal lines there (parrallel to the red lines I've added).
Only quick and fun
Of course, visualisation of randomness is nowhere near accurately assess the quality of random geneators. It is just a fun way to feel its randomness.
I hope you enjoy it.
JPG vs PNG
Pointed by Ono-Sendai on hacker news, it might be better to use png rather than jpg.
I've tried and the results for the bad ran_gen_via_time are like:
JPG
PNG

Seems not that different from my eyes. But anyway it was a good point.
https://github.com/MassD/typeocaml_code/blob/master/visualise_randomness/plot_random.ml has been updated for png support. Please remember to install libpng-devel for your OS for png saving support.
Fortuna random generator from nocrypto
@h4nnes has suggested me to try the fortuna generator from nocrypto.
opam install nocrypto
and
let _ = Nocrypto_entropy_unix.initialize()
let _ = random_plot ~filename:"random_plot_fortuna" ~ran_f:Nocrypto.Rng.Int.gen ~w:1024 ~h:1024 ~n:5
and we get

It is a very nice generator, isn't it?